Humans have on average 600,000 filtering units, or nephrons, in each kidney, or a total of 1.2 million nephrons. 1 While there is variation in function based on anatomic location, and some degree of functional interaction between nearby nephrons, each of these filtering units largely functions independently.
Each individual glomerulus/nephron (single nephron GFR) makes a small contribution towards total or systemic glomerular filtration rate (GFR). Expressed differently, measuring systemic glomerular filtration rate and dividing by total nephron number yields average single nephron glomerular filtration rate (SNGFR).
Since each glomerulus and its associated nephron function as an isolated filtration unit, looking at hemodynamics and filtration at the level of a single nephron Is a reasonable and logical approach to examining the intact, whole kidney.
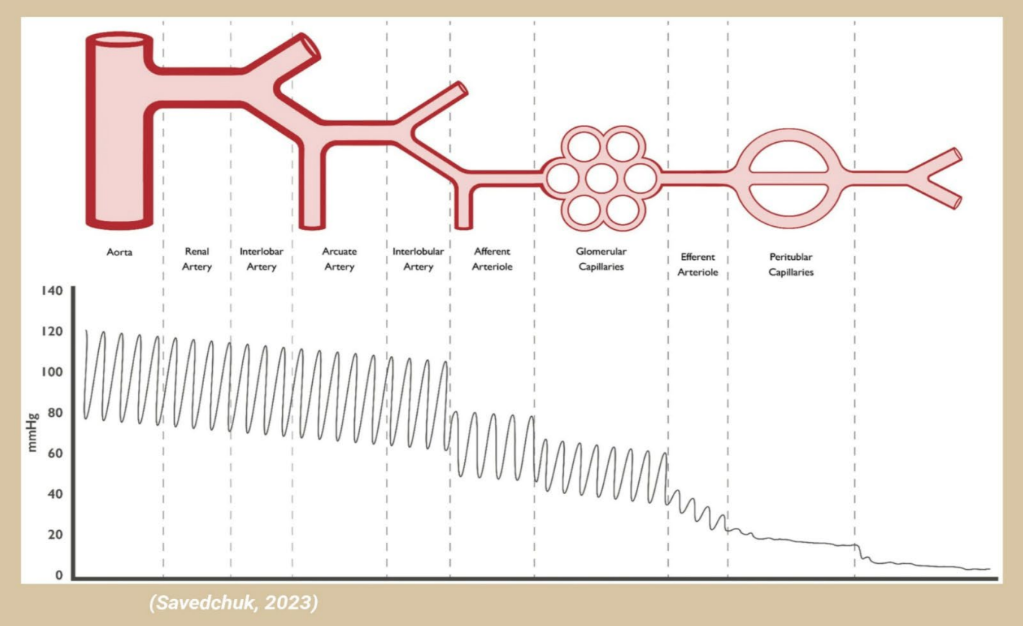
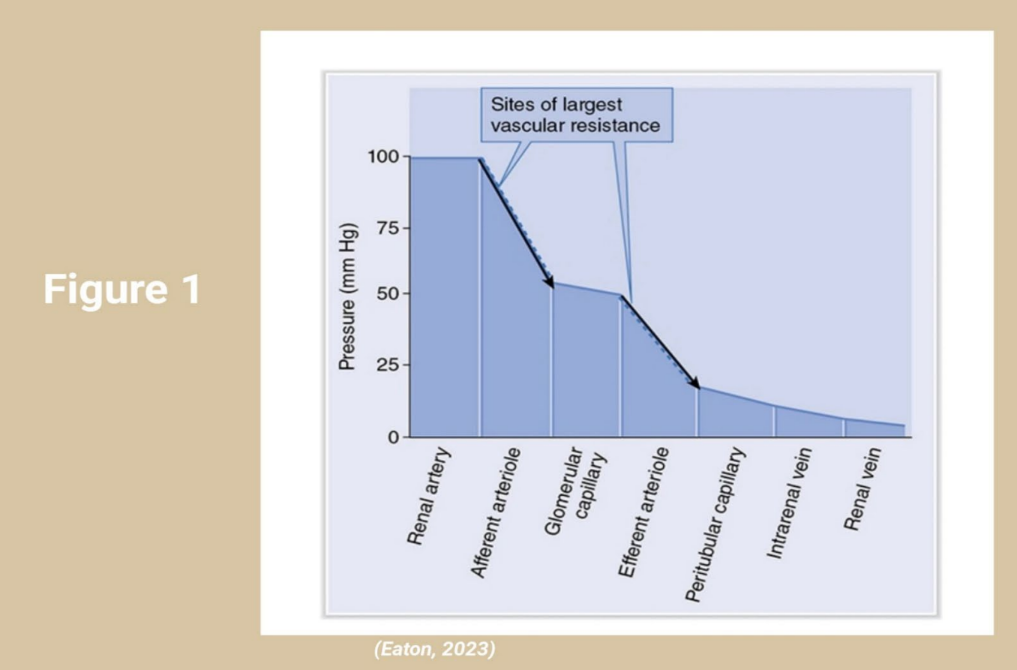
Blood traverses the single nephron circuit, flowing from segments of higher pressure to lower. The pressures in each segment are shown below in Figure 1. The top image shows the oscillations from the cardiac cycle; the bottom image has these oscillations damped to show the pressure drops more clearly in each segment.
As shown in the images, the two largest pressure drops occur at the afferent and efferent arterioles at each end of the glomerular capillary.
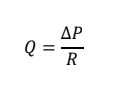
The flow through an idealized glomerular capillary can be expressed in terms of the pressure difference or drop from the beginning to end of the capillary bed divided by the resistance across the capillary:
Where:
Q = Blood/plasma flow
∆P = Pressure change
R = Resistance
In reference to vascular resistance, keep in mind Poiseuille’s Law governing resistance in laminar flow. Note that resistance is exquisitely sensitive to tube (vascular luminal) radius, being inversely related to the 4th power of the radius (see below).

Where:
R = Resistance
η = Viscosity
l = Length
r = Radius
Since the primary sites of flow resistance in the glomerular circulation are the afferent and efferent arterioles, glomerular capillary resistance can be expressed as the sum of these two resistances, and can be expressed as the pressure difference between the renal artery and vein, or Keep in mind that the equation below incorporates several approximations. Resistance and pressure drops in the smaller renal arteries and veins and peritubular capillary bed are ignored. Also note that plasma flow through the efferent arteriole Is roughly 20% lower than at the afferent arteriole, which accounts for filtration occuring along the glomerular capillary. Since blood is roughly half plasma and half red cells, this 20% decrease in plasma flow corresponds with a 10% decrease in whole blood flow.
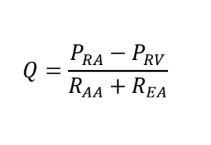
Where:
P RA = Renal artery pressure
P RV = Renal vein pressure
R AA = Afferent arteriolar resistance
R EA = Efferent arteriolar resistance
Q = Glomerular capillary flow
Glomerular capillary pressure can be expressed in terms of renal artery pressure, flow, and afferent arteriolar resistance; it can also be expressed in terms of renal venous pressure, flow, and efferent arteriolar resistance, yielding the following two equations:
PGC = PRA − (Q⋅R AA )
PGC = PRV + (Q⋅R EA )
While there is an extremely small pressure drop along the glomerular capillary from afferent to efferent
arteriole, this is negligible. So, it is reasonable to set these two equations as equal.
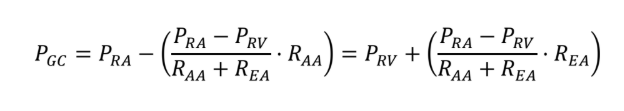
Multiply both sides by (RAA + REA ) to eliminate denominators:

Expand the terms:

Cancel identical terms (e.g., PRA RAA and PRV REA ) gives:
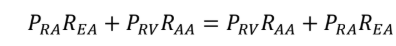
– confirming the derivation.
Reintroducing PGC into the equation gives:

Dividing both sides by (RAA + REA) yields the final equation:
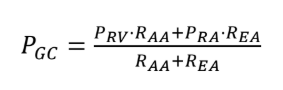
Since the highest pressure in the circuit is in the renal artery and the lowest in the renal vein, the
glomerular capillary pressure must be in between these two values. Equation 8 represents a weighted
average of these two pressures where the weights are the resistances of the opposite arteriole.
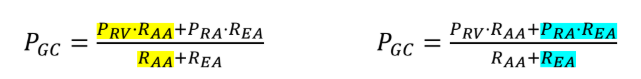
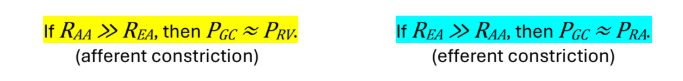
Note that:
Keep in mind that this is a conceptual mathematical model of glomerular capillary pressure. It does not
address any dynamic changes in renal arteriolar vascular resistance due to autoregulation or
neural/hormonal effects. Figure 2 below shows the effect of changes in arteriolar tone on GFR.

References
- Charlton, J. et al. (2021). Nephron number and its determinants a 2020 update_Pediatric Nephrology
(36) p.797-807. - Savedchuk S et al. (2023) Targeting glomerular hemodynamics for kidney protection_ Adv Kidney Dis
and Health 30(2) p.71-84. - Eaton DC, Pooler JP (2023) Vander’s Renal Physiology, Tenth Edition, McGraw Hill Medical.
- Ostadfar A (2016) Biofluid Mechanics Chapter 1 Fluid Mechanics and Biofluids Principles_Elsevier
Academic Press p.1-60. - Sgouralis I, Layton AT (2015) Mathematical modeling of renal hemodynamics Mathematical
Biosciences (264) p.8-20.